 I am working at the
 Don't Blindly Trust Your Java Profiler!
How do we know on what to focus our attention when trying to optimize the performance of a program? I suspect at least some of us will reach for sampling profilers. They keep the direct impact on the program execution low, and collect stack traces every so often during the program execution. This gives us an approximate view of where a program spends its time. Though, this approximation as it turns out can be surprisingly unreliable.
Humphrey started his research work wanting to make profilers produce more directly actionable suggestions where and how to optimize programs. Though, relatively quickly we noticed that sampling profilers are not only probabilistic as one would expect, but can give widely different results between runs, which do not necessarily converge with many runs either.
In 2010, Mytkowicz et al. identified safepoint bias as a key issue for sampling profilers for Java programs. Though, their results were not quite as bad as what we were seeing, so Humphrey started to design experiments to characterize the precision and accuracy of Java profilers in more detail.
How bad does it get?
Just before getting start, we’re fully aware that this isn’t a new issue and there are quite a number of great and fairly technical blogs out there discussing a large range of issues, for instance here, here, here, and here. In our work, we will only look at fully deterministic and small pure Java benchmarks to get a better understanding of what the current situation is.
What’s the issue you may ask? Well, let’s look at an example. Figure 1 shows the profiling results of Java Flight Recorder over 30 runs on the DeltaBlue benchmark. We see 8 different methods being identified as hottest method indicated by the hatched bars in red.
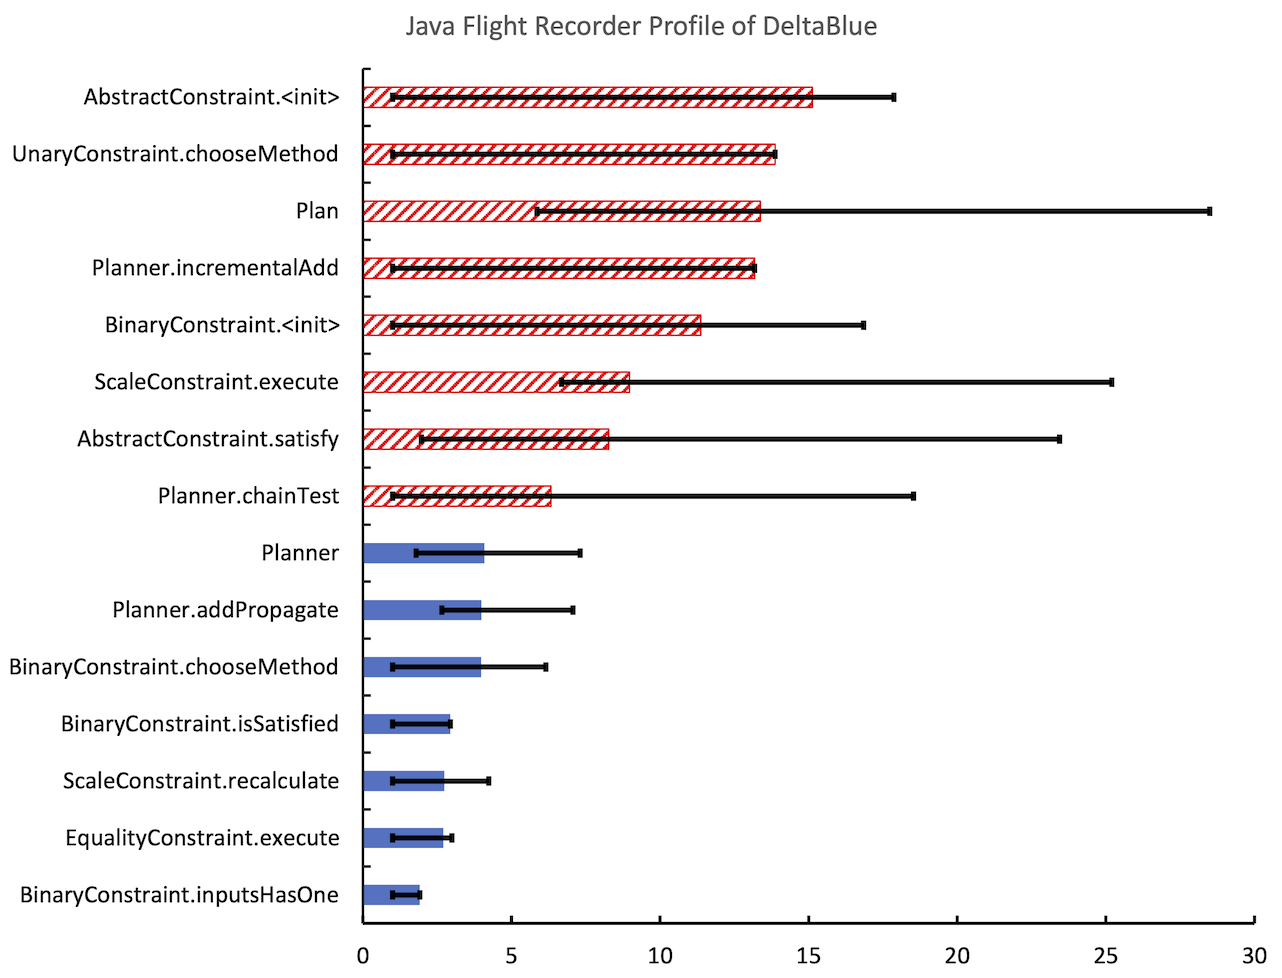
Of course much of this could probably be explained with the non-determinism inherent to JVMs such as HotSpot: just-in-time compilation, parallel compilation, garbage collection, etc. However, we run each benchmark not only for 30 times but also long enough to be fully compiled. So, we basically give the profiler and JVM a best-case scenario.1 1 At least to the degree that is practical. Though, benchmarking is hard, and there are many things going on in modern VMs. See also Tratt’s posts on the topic: 1, 2 And what do we get as a result? No clear indication where to start optimizing our application. However, if we would have looked at only a single profile, we may have started optimizing something that is rarely the bit of code the application spends most time on.
Fortunately, this is indeed the worst case we found.
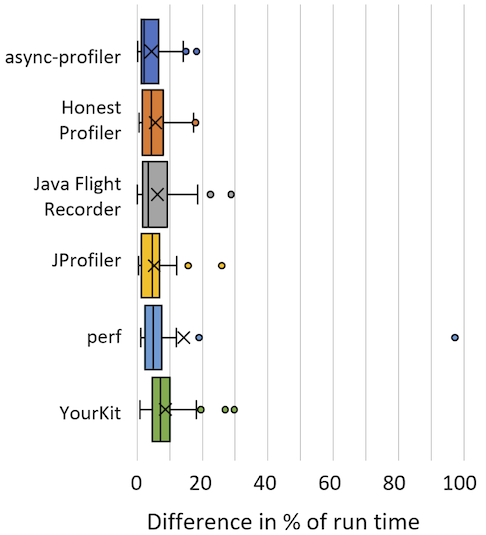
Overall, we looked at async-profiler, Honest Profiler, Java Flight Recorder, JProfiler, perf, and YourKit. Figure 2 shows box plots for each of these profilers to indicate the range of differences we found between the minimum and maximum run-time percentage reported for each method over all benchmarks. Thus, the median isn’t too bad, but each profiler shows cases where there is more than 15% difference between some of the runs.
The paper goes into much more detail analyzing the results by comparing profilers with themselves and among each other to be able to characterize accuracy and precision without knowing a ground truth. It also includes plots that show how the results are distributed for specific methods to identify possible sources of the observed variation.
So, for all the details, please see the paper linked below. Any pointers and suggestions are also greatly appreciated perhaps on Twitter @smarr or Mastodon.
Abstract
To identify optimisation opportunities, Java developers often use sampling profilers that attribute a percentage of run time to the methods of a program. Even so these profilers use sampling, are probabilistic in nature, and may suffer for instance from safepoint bias, they are normally considered to be relatively reliable. However, unreliable or inaccurate profiles may misdirect developers in their quest to resolve performance issues by not correctly identifying the program parts that would benefit most from optimisations.
With the wider adoption of profilers such as async-profiler and Honest Profiler, which are designed to avoid the safepoint bias, we wanted to investigate how precise and accurate Java sampling profilers are today. We investigate the precision, reliability, accuracy, and overhead of async-profiler, Honest Profiler, Java Flight Recorder, JProfiler, perf, and YourKit, which are all actively maintained. We assess them on the fully deterministic Are We Fast Yet benchmarks to have a stable foundation for the probabilistic profilers.
We find that profilers are relatively reliable over 30 runs and normally report the same hottest method. Unfortunately, this is not true for all benchmarks, which suggests their reliability may be application-specific. Different profilers also report different methods as hottest and cannot reliably agree on the set of top 5 hottest methods. On the positive side, the average run time overhead is in the range of 1% to 5.4% for the different profilers.
Future work should investigate how results can become more reliable, perhaps by reducing the observer effect of profilers by using optimisation decisions of unprofiled runs or by developing a principled approach of combining multiple profiles that explore different dynamic optimisations.
- Don’t Trust Your Profiler: An Empirical Study on the Precision and Accuracy of Java Profilers
H. Burchell, O. Larose, S. Kaleba, S. Marr; In Proceedings of the 20th ACM SIGPLAN International Conference on Managed Programming Languages and Runtimes, MPLR'23, p. 1–14, ACM, 2023. - Paper: PDF
- DOI: 10.1145/3617651.3622985
- Appendix: online appendix
-
BibTex:
bibtex
@inproceedings{Burchell:2023:Profilers,
  abstract = {To identify optimisation opportunities, Java developers often use sampling profilers that attribute a percentage of run time to the methods of a program. Even so these profilers use sampling, are probabilistic in nature, and may suffer for instance from safepoint bias, they are normally considered to be relatively reliable. However, unreliable or inaccurate profiles may misdirect developers in their quest to resolve performance issues by not correctly identifying the program parts that would benefit most from optimisations.

  With the wider adoption of profilers such as async-profiler and Honest Profiler, which are designed to avoid the safepoint bias, we wanted to investigate how precise and accurate Java sampling profilers are today. We investigate the precision, reliability, accuracy, and overhead of async-profiler, Honest Profiler, Java Flight Recorder, JProfiler, perf, and YourKit, which are all actively maintained. We assess them on the fully deterministic Are We Fast Yet benchmarks to have a stable foundation for the probabilistic profilers.

  We find that profilers are relatively reliable over 30 runs and normally report the same hottest method. Unfortunately, this is not true for all benchmarks, which suggests their reliability may be application-specific. Different profilers also report different methods as hottest and cannot reliably agree on the set of top 5 hottest methods. On the positive side, the average run time overhead is in the range of 1% to 5.4% for the different profilers.

  Future work should investigate how results can become more reliable, perhaps by reducing the observer effect of profilers by using optimisation decisions of unprofiled runs or by developing a principled approach of combining multiple profiles that explore different dynamic optimisations.},
  acceptancerate = {0.54},
  appendix = {https://github.com/HumphreyHCB/AWFY-Profilers},
  author = {Burchell, Humphrey and Larose, Octave and Kaleba, Sophie and Marr, Stefan},
  blog = {https://stefan-marr.de/2023/09/dont-blindly-trust-your-profiler/},
  booktitle = {Proceedings of the 20th ACM SIGPLAN International Conference on Managed Programming Languages and Runtimes},
  doi = {10.1145/3617651.3622985},
  keywords = {CPUSampling Comparison MeMyPublication Precision Profiling myown},
  month = oct,
  pages = {1--14},
  pdf = {https://stefan-marr.de/downloads/mplr23-burchell-et-al-dont-trust-your-profiler.pdf},
  publisher = {ACM},
  series = {MPLR'23},
  title = {{Don’t Trust Your Profiler: An Empirical Study on the Precision and Accuracy of Java Profilers}},
  year = {2023},
  month_numeric = {10}
}